

Quick Answer
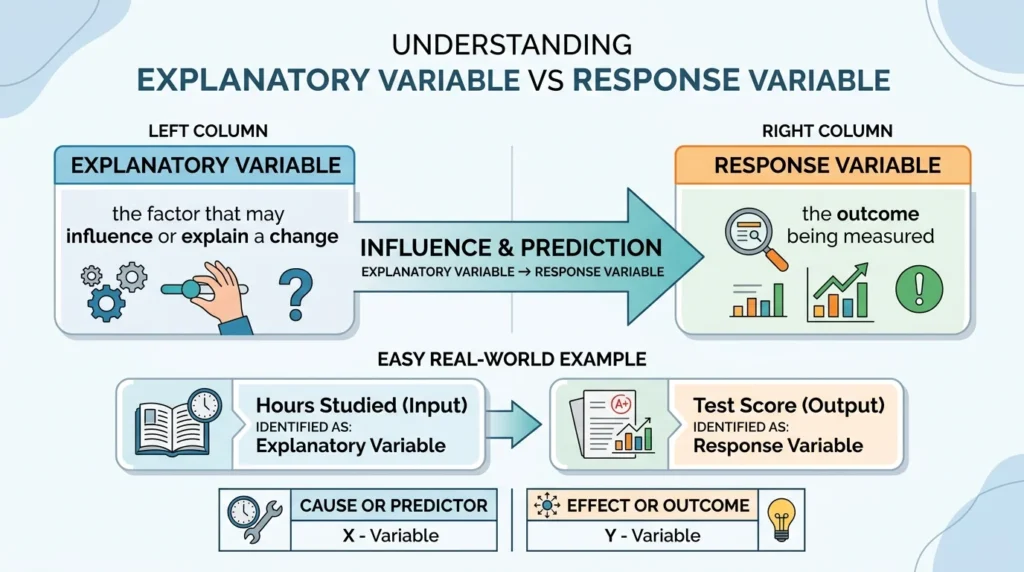
An explanatory variable is the variable that may help explain or predict a change in another variable. A response variable is the outcome being measured. For example, if you study whether hours of studying affect test scores, hours studied is the explanatory variable and test score is the response variable.
Top alternatives: explanatory variable vs response variable, predictor vs outcome variable, independent vs dependent variable, predictor variable, outcome variable
If statistics terms like “explanatory variable” and “response variable” sound more complicated than they really are, you’re not alone. The basic idea is actually pretty simple. One variable helps explain or predict what happens to another variable. The first is the explanatory variable, while the result you measure is the response variable. You’ll see these terms in statistics, research studies, experiments, graphs, and regression analysis. For example, if you want to know whether more sleep is linked to better test scores, hours of sleep can be the explanatory variable, while the test score is the response variable. Understanding the difference makes graphs and statistical questions much easier to read. Once you learn to ask “What might explain the change?” and “What outcome am I measuring?”, the two terms become much easier to remember.
What Is an Explanatory Variable?
An explanatory variable is a variable that is used to explain, predict, or account for changes in another variable.
It is often represented by x.
For example:
Hours studied → Test score
Here, hours studied is the explanatory variable because you’re investigating whether it helps explain differences in test scores.
An explanatory variable can also be called a:
- Predictor variable
- Input variable
- Independent variable
- Explanatory factor
The exact terminology can depend on the type of study.
What Is a Response Variable?
A response variable is the outcome that researchers measure or observe.
It is often represented by y.
Using the same example:
Hours studied → Test score
The test score is the response variable because it is the outcome being measured.
A response variable can also be called:
- Outcome variable
- Dependent variable
- Predicted variable
- Target variable
Explanatory vs Response Variable
The easiest way to remember the difference is:
Explanatory variable = what may explain or predict
Response variable = what responds or is measured
| Explanatory Variable | Response Variable |
|---|---|
| Possible predictor | Outcome |
| Often x | Often y |
| Used to explain variation | Measures the result |
| Comes first in many models | Represents the result |
| May influence the outcome | May change in relation to the predictor |
For example:
Temperature → Ice cream sales
Temperature is the explanatory variable.
Ice cream sales are the response variable.
Simple Example
Suppose a teacher wants to know whether studying more is associated with higher exam scores.
The variables are:
- Hours studied
- Exam score
The question is:
Does the number of hours studied help explain exam performance?
Therefore:
Explanatory variable: Hours studied
Response variable: Exam score
The explanatory variable helps predict the response variable.
Another Easy Example
Imagine you’re studying whether exercise is related to resting heart rate.
Exercise hours per week → Resting heart rate
Exercise hours are the explanatory variable.
Resting heart rate is the response variable.
The response is the outcome you’re interested in understanding.
Explanatory vs Response Variable in an Experiment
In an experiment, researchers may deliberately change one variable and observe what happens to another.
For example:
A researcher gives different amounts of fertilizer to plants and measures their growth.
Amount of fertilizer → Plant growth
Explanatory variable:
Amount of fertilizer
Response variable:
Plant growth
The researcher changes the fertilizer amount and observes the resulting plant growth.
Explanatory vs Response Variable in an Observational Study
The distinction also works in observational studies.
Suppose researchers examine whether age is related to blood pressure.
Age → Blood pressure
Age may be treated as the explanatory variable.
Blood pressure is the response variable.
However, because the study is observational, the relationship does not automatically prove that age causes the change.
That distinction matters.
Does Explanatory Mean Cause?
Not necessarily.
This is one of the most important points.
An explanatory variable can help explain or predict a response variable without necessarily causing it.
For example:
Ice cream sales → Number of people at the beach
Ice cream sales and beach attendance may increase at the same time.
But ice cream sales aren’t necessarily causing more people to visit the beach.
A third factor, such as warm weather, could influence both.
So:
Association does not automatically mean causation.
Explanatory Variable vs Independent Variable
These terms are often used similarly, but they aren’t always identical in meaning.
An independent variable is commonly used in experimental settings to describe a variable that researchers manipulate.
An explanatory variable is a broader statistical term for a variable used to explain or predict another variable.
For example:
Amount of fertilizer → Plant growth
If the researcher controls the fertilizer amount, it can be described as an independent variable.
In statistical modeling, it can also be called an explanatory variable.
Response Variable vs Dependent Variable
A response variable is often similar to a dependent variable.
Both describe the outcome being measured.
For example:
Study time → Exam score
Study time is the explanatory or independent variable.
Exam score is the response or dependent variable.
Different textbooks may prefer different terminology.
Explanatory vs Response Variable in Regression
Regression models often use explanatory variables to predict a response variable.
A simple linear regression might look like:
y = a + bx
Where:
- x = explanatory variable
- y = response variable
- a = intercept
- b = slope
For example:
Test score = a + b(hours studied)
The model estimates how test scores change as study hours change.
Explanatory vs Response Variable on a Graph
In many graphs:
x-axis = explanatory variable
y-axis = response variable
For example:
A scatterplot examining exercise and resting heart rate might place:
x-axis: Exercise hours
y-axis: Resting heart rate
This isn’t an absolute rule for every graph, but it’s a common convention.
Examples of Explanatory and Response Variables
Example 1: Studying
Explanatory: Hours studied
Response: Test score
Example 2: Advertising
Explanatory: Advertising spending
Response: Sales revenue
Example 3: Weather
Explanatory: Temperature
Response: Ice cream sales
Example 4: Fitness
Explanatory: Exercise duration
Response: Calories burned
Example 5: Plants
Explanatory: Amount of fertilizer
Response: Plant height
Example 6: Business
Explanatory: Product price
Response: Number of sales
Example 7: Sleep
Explanatory: Hours of sleep
Response: Reaction time
Example 8: Education
Explanatory: Class attendance
Response: Final grade
Example 9: Marketing
Explanatory: Email frequency
Response: Conversion rate
Example 10: Agriculture
Explanatory: Amount of water
Response: Crop yield
More Explanatory vs Response Examples
| Situation | Explanatory Variable | Response Variable |
|---|---|---|
| Studying | Hours studied | Test score |
| Exercise | Exercise time | Calories burned |
| Marketing | Ad spending | Sales |
| Weather | Temperature | Ice cream sales |
| Plants | Fertilizer amount | Plant growth |
| Business | Price | Sales volume |
| Sleep | Hours slept | Reaction time |
| Education | Attendance | Final grade |
| Farming | Water amount | Crop yield |
| Medicine | Treatment | Recovery outcome |
| Driving | Speed | Stopping distance |
| Finance | Interest rate | Loan demand |
| Website | Page load time | Bounce rate |
| Training | Practice hours | Performance score |
| Retail | Discount percentage | Number of purchases |
How to Identify the Explanatory Variable
Ask yourself:
“What variable am I using to explain or predict the other variable?”
The answer is usually the explanatory variable.
For example:
“Does exercise affect sleep quality?”
Ask:
What might explain changes in sleep quality?
Exercise.
Therefore:
Explanatory variable = exercise
Response variable = sleep quality
How to Identify the Response Variable
Ask:
“What outcome am I measuring?”
For example:
“Does fertilizer affect plant height?”
What outcome are you measuring?
Plant height.
Therefore:
Response variable = plant height
A Quick Memory Trick
Think of the phrase:
“X explains Y.”
Then:
X = explanatory variable
Y = response variable
Another easy trick is:
Explanatory = explains
Response = responds
So if:
Study time explains test score
Study time is explanatory.
Test score is the response.
Explanatory Variable in Word Problems
Statistics questions often hide the variables inside a sentence.
For example:
“Researchers want to determine whether the amount of daily screen time predicts sleep duration.”
Find the predictor:
Daily screen time
That’s the explanatory variable.
Find the outcome:
Sleep duration
That’s the response variable.
Response Variable in Word Problems
Look for phrases such as:
- Outcome
- Result
- Predicted
- Measured
- Affected
- Response
- Change in
For example:
“Researchers measure plant growth after applying different amounts of fertilizer.”
The measured outcome is:
Plant growth
Therefore, it is the response variable.
Can There Be More Than One Explanatory Variable?
Yes.
A statistical model can contain several explanatory variables.
For example, researchers might predict house prices using:
- Square footage
- Number of bedrooms
- Location
- Age of the house
The response variable is:
House price
The others are explanatory variables.
Multiple Explanatory Variables Example
Suppose a company wants to predict sales.
It might use:
- Advertising spending
- Product price
- Number of promotions
- Website traffic
as explanatory variables.
The response variable could be:
Monthly sales
This is common in multiple regression.
Can There Be More Than One Response Variable?
Yes, in some research designs.
A study might examine how one factor affects several outcomes.
For example, researchers could study whether exercise affects:
- Resting heart rate
- Blood pressure
- Fitness score
Each outcome can be treated as a response variable in a particular analysis.
Categorical Explanatory Variables
An explanatory variable doesn’t have to be numerical.
It can also be categorical.
For example:
Type of training → Performance score
Training type might include:
- Online
- In-person
- Hybrid
Performance score is the response variable.
Categorical Response Variables
Response variables can also be categorical.
For example:
Treatment → Recovered or not recovered
The response variable could be:
Recovery status
This is common in logistic regression and classification problems.
Numerical Explanatory Variables
A numerical explanatory variable contains measurable quantities.
Examples include:
- Age
- Income
- Temperature
- Weight
- Distance
- Time
- Price
For example:
Temperature → Electricity usage
Temperature is the numerical explanatory variable.
Numerical Response Variables
A numerical response variable measures an amount.
Examples include:
- Test score
- Weight
- Height
- Revenue
- Sales
- Reaction time
For example:
Study hours → Test score
Test score is numerical and serves as the response variable.
Common Mistakes
Mistake 1: Assuming X Always Causes Y
An explanatory variable doesn’t automatically cause the response.
Mistake 2: Mixing Up Predictor and Outcome
Remember:
Predictor = explanatory
Outcome = response
Mistake 3: Assuming the Terms Are Always Fixed
The role of a variable depends on the research question.
For example, age might be an explanatory variable in one study and a response variable in another.
Mistake 4: Ignoring the Study Design
An observational study can show relationships without proving causation.
Why the Difference Matters
Knowing which variable is explanatory and which is a response helps you understand:
- Scatterplots
- Correlation
- Regression
- Experiments
- Statistical models
- Research questions
- Data analysis
It also helps you interpret what a statistical model is actually trying to predict.
Explanatory vs Response Variable: Easy Comparison
Think about a simple arrow:
Explanatory Variable → Response Variable
Examples:
Hours studied → Exam score
Temperature → Ice cream sales
Advertising → Revenue
Fertilizer → Plant growth
Exercise → Fitness score
The variable on the left is generally the explanatory variable.
The variable on the right is generally the response variable.
FAQs
What is an explanatory variable?
An explanatory variable is used to explain or predict changes in another variable.
What is a response variable?
A response variable is the outcome being measured or predicted.
Is the explanatory variable X or Y?
It is commonly represented by X.
Is the response variable X or Y?
It is commonly represented by Y.
Is the explanatory variable independent?
It can be, especially in an experiment, but the terms aren’t always perfectly interchangeable.
Is the response variable dependent?
Yes, response and dependent variable are often used for the same basic concept.
Can an explanatory variable be categorical?
Yes. Examples include gender categories, treatment groups, product types, or education levels.
Can there be multiple explanatory variables?
Yes. Regression models often use several predictors.
Does an explanatory variable cause the response variable?
Not necessarily. A statistical association doesn’t automatically establish causation.
What is the easiest way to remember the difference?
Think: explanatory explains, response responds.
Conclusion
The difference between an explanatory variable and a response variable becomes much easier once you focus on their jobs. The explanatory variable is the factor used to explain or predict something, while the response variable is the outcome being measured. In a simple example like hours studied and test scores, study time is explanatory and the test score is the response. Just remember that an explanatory variable doesn’t automatically prove causation. Once you can identify the predictor and the outcome, you can usually label the two variables correctly in statistics problems, graphs, experiments, and regression models. Keep the simple formula in mind: X explains Y, and Y responds.
See Also More :
- 200+ Happy Mother’s Day Replies: That Are Sweet, Emotional & Perfect to Send
- 300+ How to See Replies on X (Twitter): Complete Guide for Mobile, Desktop and Hidden Conversations 2026